This post explains a home-grown personal finance tool that aggregates transactions from various bank accounts and credit cards, auto-categorizes them, and presents information/analyses via a set of dashboards. All this is accomplished without sharing your banking credentials and financial transactions with a third party.
Background and requirements
Every night, before going to bed, my parents would sit at the dining table, recall the main expenses of the day, and write them down in a notebook. Growing up, I swapped the notebook with a spreadsheet. Gradually, it was no longer satisfactory to merely “write down what I could remember at the end of the day”. I wanted to obsessively track every financial transaction, across multiple bank accounts and credit cards, glean insights from the data (e.g. How have grocery costs changed over time?), and share everything with my wife in a straightforward manner.
There are a number of services, like Mint, Personal Capital, etc. that provide this functionality. However, that requires sharing the login credentials of your financial accounts with a third party. Moreover, I have qualms about sharing financial data with third parties because I don’t trust them to not abuse it in a variety of ways. So I went the Do-It-Yourself route and built a scrappy personal finance tool that does not involve any for-profit third party FinTech company and meets the following requirements
- Easy retrieval/ingestion of transaction data from financial institutions. Either automated retrieval directly from the institution (preferred) or automated parsing of a downloaded statement
- Storage of financial transactions in a query-able database
- Auto-categorization of transactions
- Pretty dashboards showing frequently needed information on a monthly basis e.g. spending by category
- Straightforward way to share the dashboards with others (e.g. my wife)
Solution sketch
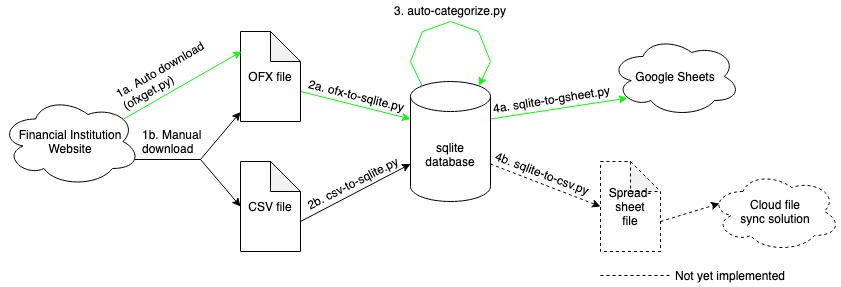
The four steps of the solution
The solution sketched in the figure above shows the four main work steps involved. Each step is executed through its own Python 3 script. The steps are
- Retrieval of transactions. Either
a) automatically using the OFX protocol or
b) manual download of statement - Adding retrieved transactions to a database.
- Auto-categorization of newly added transactions
- Creation of shareable dashboards from the categorized transactions
All of the above steps can be triggered by a single command, which runs the relevant Python scripts in sequence. Each step is detailed in the section below.
Detailed steps
Step 1: Retrieval of transactions
There are a two different ways to fetch transactions from the financial institution: automated and manual.
The automated method makes use of the OFX (Open Financial Exchange) protocol and data format, through Python’s ofxtools library. In brief, some financial institutions offer a server socket to which ofxtools can connect, authenticate, and fetch transaction data, using the ofxget command. The usage of ofxget is well-documented. It requires some messing around with an ofxget.cfg file that contains parameters and credentials for the financial institution. Sometimes, the initial connection attempt is unsuccessful and you may need to log in to your financial institution and manually approve the connection as a one-time action. In my case, most of my banks and credit card companies supported OFX connections and it is possible to successfully connect and fetch transaction data with a script. But in some cases, this automated method simply does not work, maybe because the financial institution does not support OFX connections.
When the automated method fails, one must resort to the manual method. This means simply logging in to the financial institution and downloading a statement (usually a monthly statement, or with specific start and end dates). The download can be in either OFX/QFX format (sometimes called as Microsoft Money or Quicken Web Connect format) or in the more traditional comma separated value (.csv) format (sometimes called as Microsoft Excel format).
Regardless of whether the automated or manual method is used, the end result is a .ofx/.qfx file or a .csv file containing the financial transactions for the time period specified in the statement.
Step 2: Adding retrieved transactions to a database
A python script parses the downloaded .ofx/.qfx or .csv file and adds transaction data to an sqlite database. The database has a table for each financial institution. The columns in the table are straightforward: TransactionId, DatePosted, Payee, Amount, Memo, Category, Notes. These columns capture the key parameters of a transaction. There’s an additional table for each financial institution that captures meta-information for each transaction: the timestamp at which it was added to the database and whether the transaction has been added to a secondary data pool from which dashboards can be created – more on that later.
The script reads each transaction in the downloaded statement and adds it to the sqlite database after verifying that the database doesn’t already contain the same transaction id (to prevent adding duplicate transactions). While this is done, the ‘Category’ column for each transaction row is kept empty. The categorization happens in the next step.
Step 3: Auto-categorization
This is where some cool stuff happens. I am using a Random Forest classifier that trains on all previously classified transactions in the database to predict the category of any new unclassified transaction. This is wrapped in an interactive console script that, for each transaction being categorized, displays the predicted category and offers the opportunity to manually correct it if needed. The beauty of this approach is that the classifier becomes increasingly accurate over time, since most of my new transactions are similar to older transactions (same vendors/payees, shops, websites etc. where I regularly spend money). Each month, from out of hundreds of individual transactions, I need to manually correct the auto-categorizer’s output a couple of times at most. The interactive auto-categorization script makes this extremely simple to do, as I can approve or modify the predicted category in real time.
Python’s scikit-learn and pandas libraries do most of the heavy lifting. The actual categorization code, not counting data imports/exports, is barely 10 lines of code.
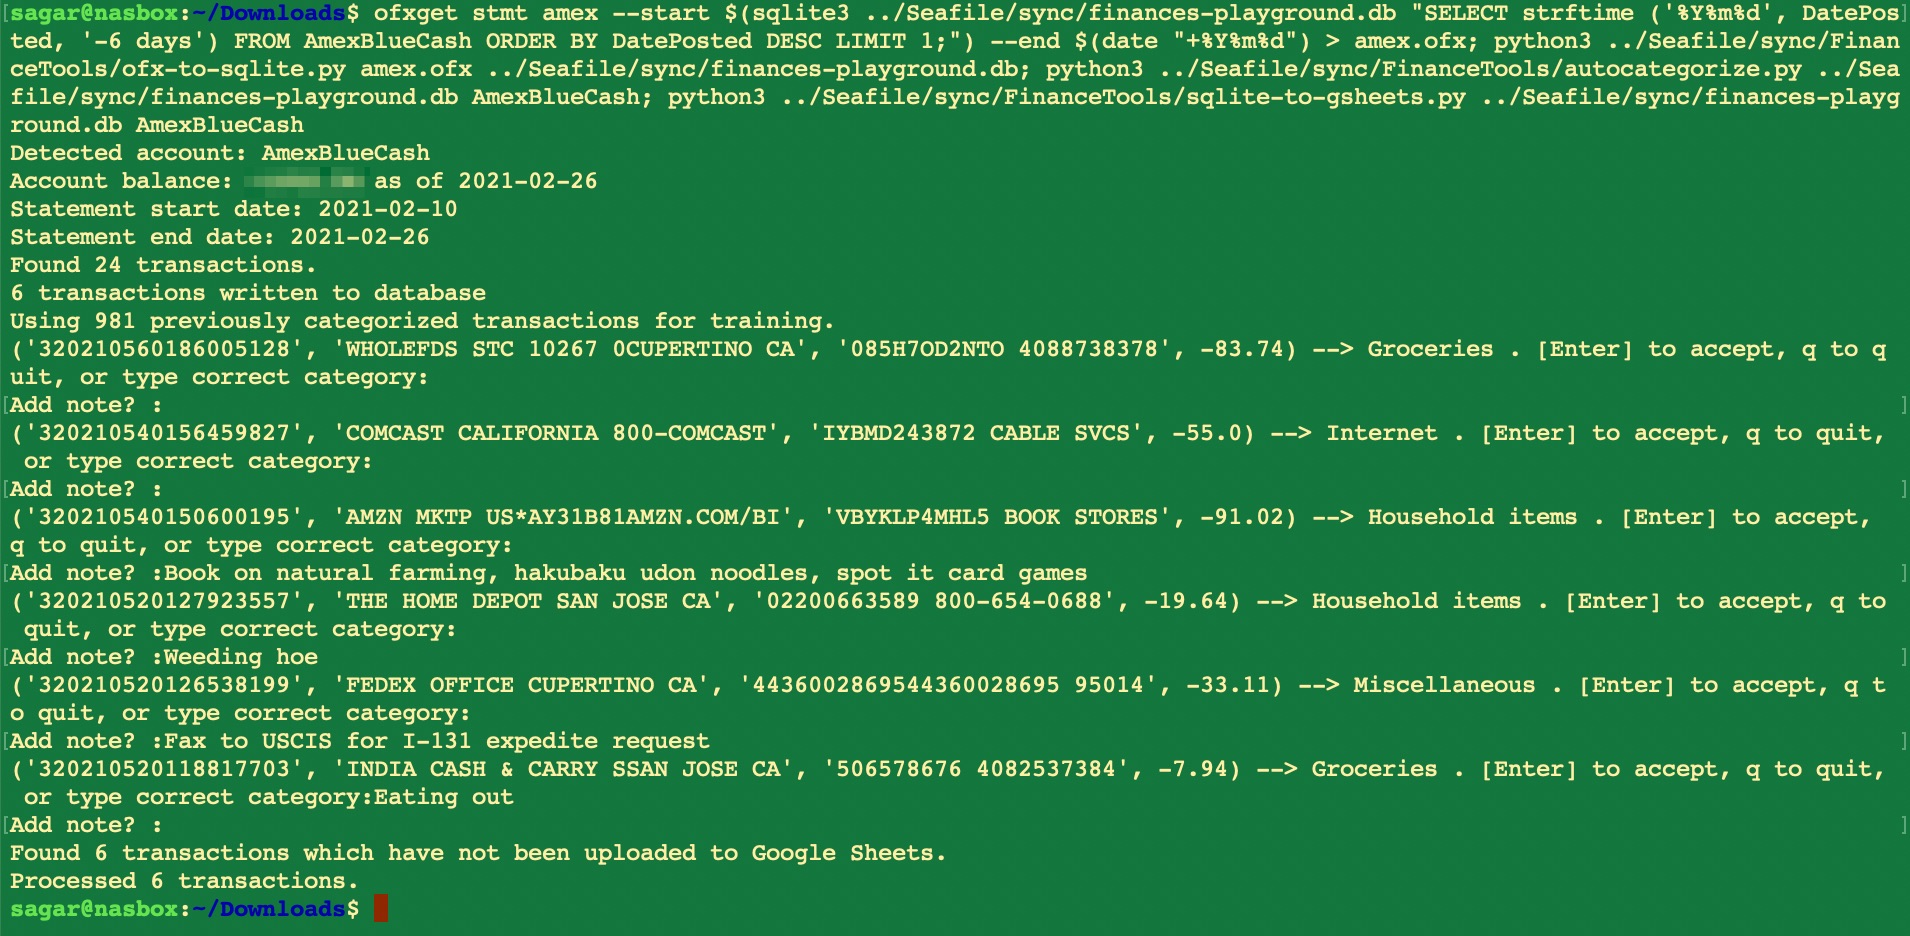
An example auto-categorization run
Step 4: Creation of shareable dashboards
Okay, so with the previous steps, we have a database populated with categorized financial transactions. How to present this data in a meaningful way and get quick insights from it? There are a number of readily available ways to query a database and present information on a dashboard. This is where I compromised my idealism to some extent. Instead of using a self-hosted or similar privacy-friendly alternative, I used Python’s gspread library to send the transactions to a particular tab (named ‘Transactions’) of a particular Google Sheets spreadsheet in my Google Drive. This spreadsheet has tabs for each month and some scripts that pick up data from the Transactions tab and present it in a variety of tables and graphs. Essentially, the tab for each month becomes a dashboard showing my financial transactions and computed information in exactly the way I want to see them. I can see spending by category, in terms of fixed and variable costs, income vs expenditure, monthly savings, and a whole lot more. This spreadsheet is shared with my wife through her Google account. All she needs to do, is pull up the spreadsheet and review our finances whenever she wishes to do so!
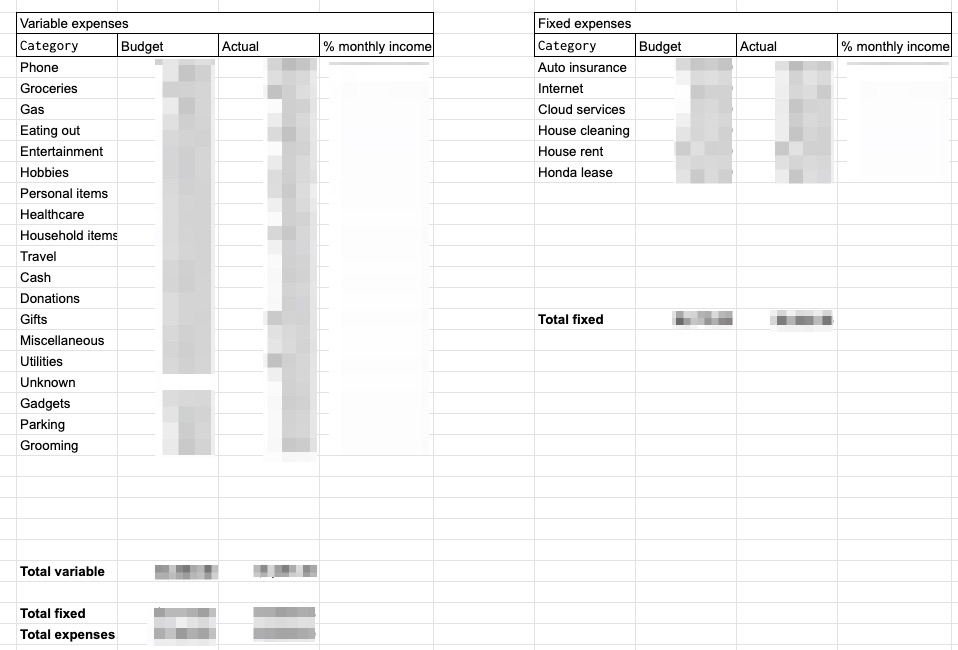
Example Google spreadsheet dashboard: Summary of monthly expenses by categories
Summary
This setup has been working flawlessly for over three years. At regular intervals, I open up a terminal window, execute a single script, and it automatically downloads my credit card and bank transactions, adds new ones to a database, accurately categorizes them, and then updates a dashboard that shows meaningful information aggregated from the raw transactions. For some banks, I need to manually download a statement once a month, and the rest is automated. The sqlite database containing all the financial transactions supports arbitrary SQL queries, for occasions when I need to query something specific that the dashboards do not show.
This simple system helps me stay on top of my finances without involving any third parties whom I would otherwise need to trust with bank login credentials and who might farm my financial data in ways I would be uncomfortable with.
If you are interested in the actual scripts, send me a message. Then I’ll clean them up, upload to github, and send you the link to the github repository. Update: The raw, not-cleaned scripts are in this GitHub repository. They are messy. You have been warned!